Originally published on Towards AI.
Picture this.
It’s 2 am. You’re on a trolley in a hospital corridor. Not a ward. A corridor. Fluorescent lights, the smell of disinfectant, the sound of a ward that’s full somewhere behind a set of doors that won’t open for you yet.
A doctor saw you three hours ago. She decided you needed to be admitted. She wrote it down, made the call, and moved on to the next patient. The bed she ordered for you doesn’t exist yet. So you wait. On the trolley. In the corridor. While the clock runs.
This isn’t a worst case scenario. This is Tuesday.
I’ve been building data pipelines on NHS performance data for the past few months: outpatient records, referral-to-treatment waiting times, and now A&E. The deeper I go into this data, the more I realise that what I’m looking at isn’t a system under pressure. It’s a system that has quietly normalised something that should never be normal.
1,280 patients. Every single day. Stuck in corridors after a doctor had already decided they needed a bed.
I needed to see that number. So I built something to track it properly.
The target nobody is hitting
The NHS has a target. It’s been there since 2000. 95% of patients arriving at A&E should be seen, treated, and either admitted, discharged or transferred within four hours of arrival.
Simple enough. Measurable. Published every month by NHS England for anyone to download.
So I downloaded it. All of it. 36 months. April 2022 to March 2025. Every NHS Trust in England, every month, their numbers sitting in CSV files on a government website that most people will never visit.
I built a Bronze→Silver→Gold medallion pipeline in Python — ingesting the raw files, cleaning and classifying them, then calculating the metrics that matter. 36 files. 7,238 rows of provider-level data after transformation. Three Gold tables: national, regional, trust-level.
Then I ran the numbers.
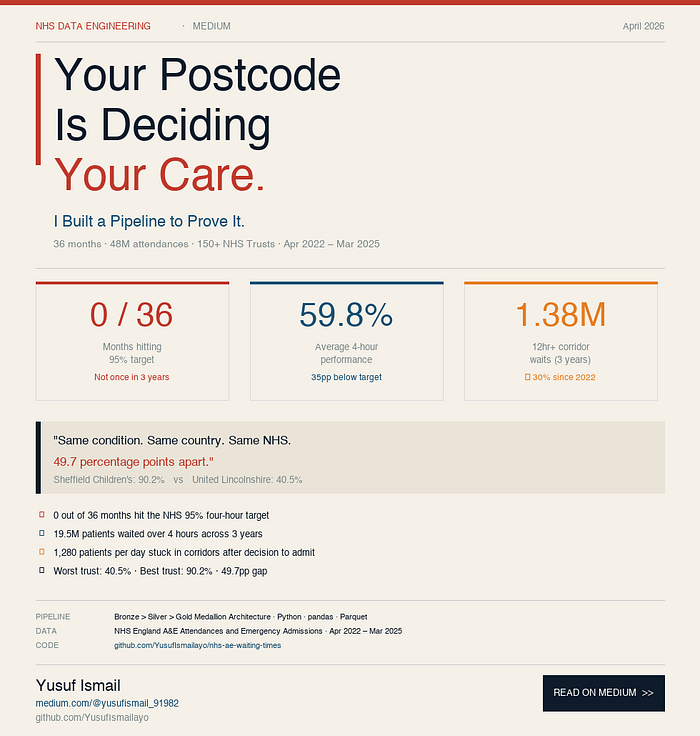
0 out of 36 months hit the 95% target. Not one. Not even close.
The best month in three years was April 2023–65.5%. The worst was December 2023–54.3%. The average across the entire period was 59.8%. The NHS is, on average, 35 percentage points below its own target. Every single month.
19.5 million people waited over four hours in a major A&E between April 2022 and March 2025. That’s 19.5 million moments where someone sat in pain, or fear, or exhaustion, past the point the system promised they wouldn’t have to.

Underneath the four-hour headline sits a number that doesn’t get enough attention — the 12-hour wait. Not 12 hours to be seen. 12 hours after a doctor has already decided you need to be admitted. You’re in the corridor. The system just can’t find anywhere to put you.
Across three years, 1,381,891 people experienced this. And it’s getting worse:
2022/23: 410,029 corridor waits of 12 hours or more
2023/24: 439,411
2024/25: 532,451
That’s a 30% increase in three years. December is consistently the worst month — an average of 50,879 people waiting 12 hours or more, every December, like clockwork. Winter is not a surprise. It happens every year. The system knows it’s coming.

I was on a call earlier this year with my assessor. Somewhere in the conversation, I mentioned what I’d been building — the NHS pipeline, the waiting times data, the postcode lottery finding starting to emerge from the numbers.
She paused. Then she told me about where she lives in rural Wales. If she phones her GP in the morning, she gets seen the same day. Her father, who lives in England, has to go online, fill in a form, and hope the algorithm decides he’s urgent enough.
She told me about ambulances. Where she lives, they come. In England, she said, they ask you first if you’re breathing — because the triage system is so pressured that the questions you answer on the phone determine whether help arrives at all. She mentioned delays in care for her father during a serious health episode. I didn’t probe further.
She mentioned that once, in her part of Wales, the coastguard came when she called for an ambulance. Because that’s who could get there first.
I went back to my data.
Because what she described — that gap, that difference in what the system gives you depending on where you happen to live — is exactly what the numbers show.
The best performing region in England over three years is the South East, at an average of 63.9%. The worst is the North West, at 55.2%. But the regional gap is nothing compared to the trust-level gap.
Best performing major A&E trust: Sheffield Children’s NHS Foundation Trust — 90.2% average.
Worst: United Lincolnshire Hospitals NHS Trust — 40.5%.
49.7 percentage points between them. Same country. Same target. Same NHS. Different postcode.

I live in Telford.
When I pulled the trust-level data and sorted it, I wasn’t looking for anything specific. I was just reading down the worst performers list.
There it was.
The Shrewsbury and Telford Hospital NHS Trust. Third worst in England. 43.6% average four-hour performance over 36 months. 825 patients per month waiting 12 hours or more after a decision to admit.
This is the hospital that serves the town I live in.
The A&E my family would go to if something went wrong tonight.
43.6%.
I don’t say that to attack the staff. Anyone who has worked in or around the NHS knows that the people on the floor are doing everything they can. But the data is the data. And the data says that if you live in Telford and you go to A&E, fewer than half of patients are being seen within the target time. Every month. Consistently. For three years.
That’s not a bad week. That’s the baseline.
What the data actually says
This is what three years of NHS A&E data tells us:
The system is not recovering. Every region in England performed worse in 2023/24 than in 2022/23. Most steadied slightly in 2024/25 but never recovered ground. The North West has been below 56% for three consecutive years. The Midlands has accumulated 314,606 twelve-hour corridor waits since April 2022.
The 95% target was last met nationally in 2015. That’s a decade ago.
48 million people attended a major A&E in England between April 2022 and March 2025. Nearly 20 million of them waited longer than they should have. 1.38 million were left in corridors after a doctor had already decided they needed care.
And if you want to know whether you’re likely to be one of them, the most reliable predictor isn’t how sick you are. It’s where you live.
The pipeline
The full code is on GitHub — Bronze ingestion, Silver transformation, Gold analytical tables. Every number in this article comes directly from NHS England’s published data, processed through a reproducible pipeline anyone can clone and run.
GitHub: https://github.com/YusufIsmailayo/nhs-ae-waiting-times
Close
My assessor ended that part of our conversation by saying something I keep coming back to.
She said: where you live shouldn’t determine the care you get.
She said it casually, like it was obvious. Like it was something everyone already knew.
Maybe they do. Maybe that’s the problem. We know it. We’ve known it for years. The data has been published every month. The target has been missed every month. And the corridor is still full at 2am.
1,280 people today. Stuck. Waiting. After the decision was already made.
I built a pipeline to measure it. I’m not sure that’s enough. But it felt important to count.
Yusuf Ismail is a data engineer building NHS analytics pipelines. His previous projects cover 226 million outpatient records and 14 million RTT pathways. GitHub: YusufIsmailayo | Medium: @yusufismail_91982
Published via Towards AI